The Asymmetry of Returns: An Ode to Quality Active Management
Q2 | June 2025

Topic: Investments
June 19, 2025
Image used with permission: iStock/Ridofranz
Download This Issue
Download this full issue of Nexus Notes QuarterlyOn a Side Note…
See another Investments Nexus Notes Quarterly article that may be of interest to you.
2025 in Review: Addressing Client Questions on the Economy, the Stock Market, and AI
The Asymmetry of Returns: An Ode to Quality Active Management
Q2 | June 2025
If you’re a long-standing Nexus client, you have heard us say, oh, a few thousand times, how important it is to protect capital in down markets. Intuitively it makes sense: goal = try not to lose money.
But, we are invested in capital markets, and those markets rise and fall for a myriad of reasons beyond the sensible, including rumours, click-bait headlines and the constant tug-of-war between fear and greed. Markets often defy fundamental logic in the short term and can be driven by emotional extremes, algorithmic trading, and the whims of speculative traders. Passive investors may ride the ups, but they are equally exposed to sharp declines that can erode gains before rationality is restored. By acknowledging this irrationality, we can build strategies that seek to exploit inefficiencies rather than be at their mercy.
As an active equity and bond manager whose main objective is to create real wealth for our clients over the long term, avoiding all negative returns is Utopian, especially over short time periods. Although we do not manage to any market or index, some clients use market proxies to compare our performance, and so relative returns matter to them. If you ask us, our preference is to achieve positive, real, absolute returns rather than positive relative returns. As Nexus colleague Denys Calvin often says, “You can’t eat relative hamburgers.”
But why do we keep emphasizing downside protection over upside capture? If markets go up more often than down, isn’t it enough just to be invested in an index product? Why do we worry so much about the much-less-frequent dips? To quote Shelby Cullom Davis1, a U.S. businessman, investor and philanthropist (also quoted by Denys in his 2019 blog on a similar topic): “You make most of your money in down markets – you just don’t realize it”.
And the reason for this essentially comes down to two things: volatility, and the concept of asymmetric returns.
The Numbers
For those who have no need to withdraw from their portfolio, it can be argued that volatility doesn’t matter, as long as your investment strategy is aligned with your risk tolerance and a long investment time horizon. For them, an index fund might be fine if they can stomach the wild swings it brings. However, most people – and most of our clients – withdraw money at some point, whether a regular amount to cover lifestyle expenses, or in chunks to make gifts, purchase a big-ticket item, or pay tax. In this respect, volatility does matter. Volatility – or the fluctuation of asset values from time to time – can cause not just a bad night’s sleep, but also real and permanent loss of capital if one withdraws from the portfolio at a time when it’s down. Minimizing those downward swings is the key.
This risk becomes particularly acute for retirees and income-focused clients who rely on systematic withdrawals. When a portfolio suffers significant losses early in a withdrawal phase, subsequent withdrawals represent a larger proportion of the remaining assets, compounding losses and reducing future income potential. This sequence-of-returns risk underscores why smoothing the ride is essential: it preserves both capital and the psychological comfort needed to stick with a long-term plan.
This is the beauty of quality active management, and often the math behind it is overlooked. Simplistically, this concept can be shown by the example below:
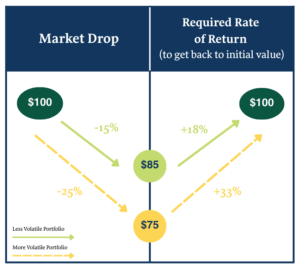
Imagine two portfolios: 1) the “market” (represented by any index fund, for example, an S&P500 ETF) and 2) a less volatile portfolio with downside protection. Let’s call this second one a “quality” portfolio, as these characteristics are typically associated with quality investing (as Nexus employs). Quality management entails identifying companies that have characteristics such as low or manageable leverage, low cyclicality, proven profitability, ability and willingness to pay dividends, strong management, and a stable business model. Nexus, following our growth-at-a-reasonable-price style, prefers to purchase these companies at reasonable valuations, which also contributes to downside protection.
If you start with $100 and the market drops 25%, you have $75 left. To get back to that original $100 you need a return of +33%, not just 25% (hence the term ‘asymmetric’). Now let’s look at the quality portfolio. If that portfolio went down 15% (because it’s less volatile), you’d need only 18% to get back to $100. So, going down less is clearly better because your portfolio essentially has to work less hard to recoup its losses.
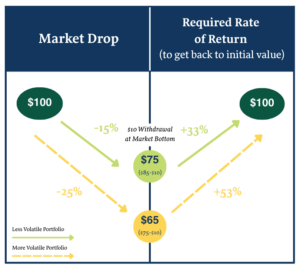
Now, let’s say you need money, and the market happens to be down. In the chart below, we’ve taken $10 out at the bottom of the market and calculated the return needed to get back to $100. In this case, the differences are even more dramatic – you need an additional 20% (53%-33%) for the market portfolio but only 15% (33%-18%) more for the quality portfolio. This example illustrates how hard a portfolio without a downside protection bias has to work simply to catch up, let alone have a chance at outperforming.
The Nexus Advantage
The benefit of a Nexus portfolio is that – on average over the long term – not only does it decline less than the market in weak periods, it also manages to keep up with the market in positive return periods, creating what now-retired Nexus colleague Fergus Gould called a “ratchet effect”.
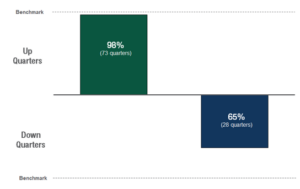
To illustrate, below we present charts that show data on the Nexus North American Balanced Fund (as a proxy for a typical balanced client), in both up-and-down-market capture, and risk versus return over the last 25 years. The Balanced Fund, relative to its benchmark, has achieved solid performance in up markets, capturing, on average, 98% of the market return in positive periods (green bar). However, it has performed significantly better in down markets, capturing, on average, only 65% of the market decline (blue bar).
Balanced Fund Up- & Down-Market Capture Ratios (2,3,4)
The result of this “ratchet effect” is shown in the chart below. Risk (measured by standard deviation of returns) and annualized return (measured on a time-weighted, total return basis) of the Balanced Fund are superior to the benchmark against which the Fund is measured. Charts for our North American Equity Fund and Income Fund show similar results.
Risk / Return Profile Since January 1, 2000 (3,4,5)
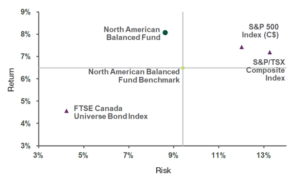
Both of these charts are evidence that Nexus’s quality, long-term approach to portfolio management benefits clients.
Conclusion
As with everything return-related in investing, we can’t promise that this up/down behaviour will work all the time, especially in short-term time periods. However, we can assure our clients that we remain steadfast in our portfolio management discipline and will not stray from our founding philosophy from 37 years ago which focuses on long-term wealth creation and capital preservation, especially in down markets. As they say, “Don’t fix what ain’t broke.”
[1] https://en.wikipedia.org/wiki/Shelby_Cullom_Davis
[2] Each quarter since January 1, 2000 is defined as an “up” or “down” quarter based on whether the benchmark return for the quarter was positive or negative. For up (down) quarters, the capture ratio is the ratio of compound average rates of return for the Fund and its benchmark for such quarters. For more information about benchmarks, please refer to https://tinyurl.com/NexusOnBenchmarks.
[3] All Nexus returns upon which these charts are based are time-weighted, total rates measured in Canadian dollars and calculated after deducting such direct and indirect costs as applicable withholding taxes, trading commissions, custody fees and other fund/account expenses, but without deducting Nexus’s management fees (which are charged to client accounts and vary by client). Underlying returns for market indices and benchmarks are presented on the same basis, but without any such deductions. Past performance is not indicative of future results.
[4] Balanced Fund benchmark is 5% FTSE Canada 91 Day T-Bill Index, 30% FTSE Canada Universe Bond Index, 40% TSX, and 25% S&P 500 (in C$); rebalanced monthly.
[5] Risk is calculated as the annualized standard deviation of monthly returns since January 1, 2000.